
In his first Executive Decision segment of his “Mad Money” program Wednesday, Jim Cramer spoke with Oisin Hanrahan, CEO of Angi Homeservices Inc. (ANGI) , the listing service that has changed its Angie’s List brand to Angi.
Hanrahan said the market for home services totals $500 billion and Angi aims to be the one-stop shop for everything homeowners needs. The company’s websites and apps connect more than 20 million homeowners to more than 250,000 contractors and service providers. Hanrahan said by making home repair and improvement easier to access, Angi is helping them get the most from their homes.
Let’s check out ANGI’s charts and indicators to see what we can get out of them.
In this daily bar chart of ANGI, below, we can see that prices rallied from the March 2020 low into a high in July. Prices slowly corrected until early November before another upside move into February. The February high was not long sustained and prices pulled back into early March. ANGI is trading above the rising 50-day moving average line, which was successfully tested in February and early March. The slope of the slower-to-react 200-day moving average line is also positive.
The trading volume and the On-Balance-Volume (OBV) line are not constructive. Trading volume was more active from July to early November when prices declined and it has not expanded in the advance from November. The On-Balance-Volume (OBV) line has declined from July to January and then went flat. This tells me that sellers of ANGI have been more aggressive for months and have not confirmed the new high made in February. The trend-following Moving Average Convergence Divergence (MACD) oscillator has been above and below the zero line the past 12 months. It is currently above the line but certainly not robust.
In this weekly bar chart of ANGI, below, we can see a serious decline from 2018 to early 2020. It could be argued that the rally from March 2020 is just a recovery rally as prices have only retraced slightly more than 50% of the prior decline. Prices are trading above the rising 40-week moving average line. The weekly trading volume has declined since July and the OBV line also peaked back in July. Note that the OBV line has made a bearish divergence since February; prices made a new high but the OBV line has not. The MACD oscillator is bullish in this time frame.
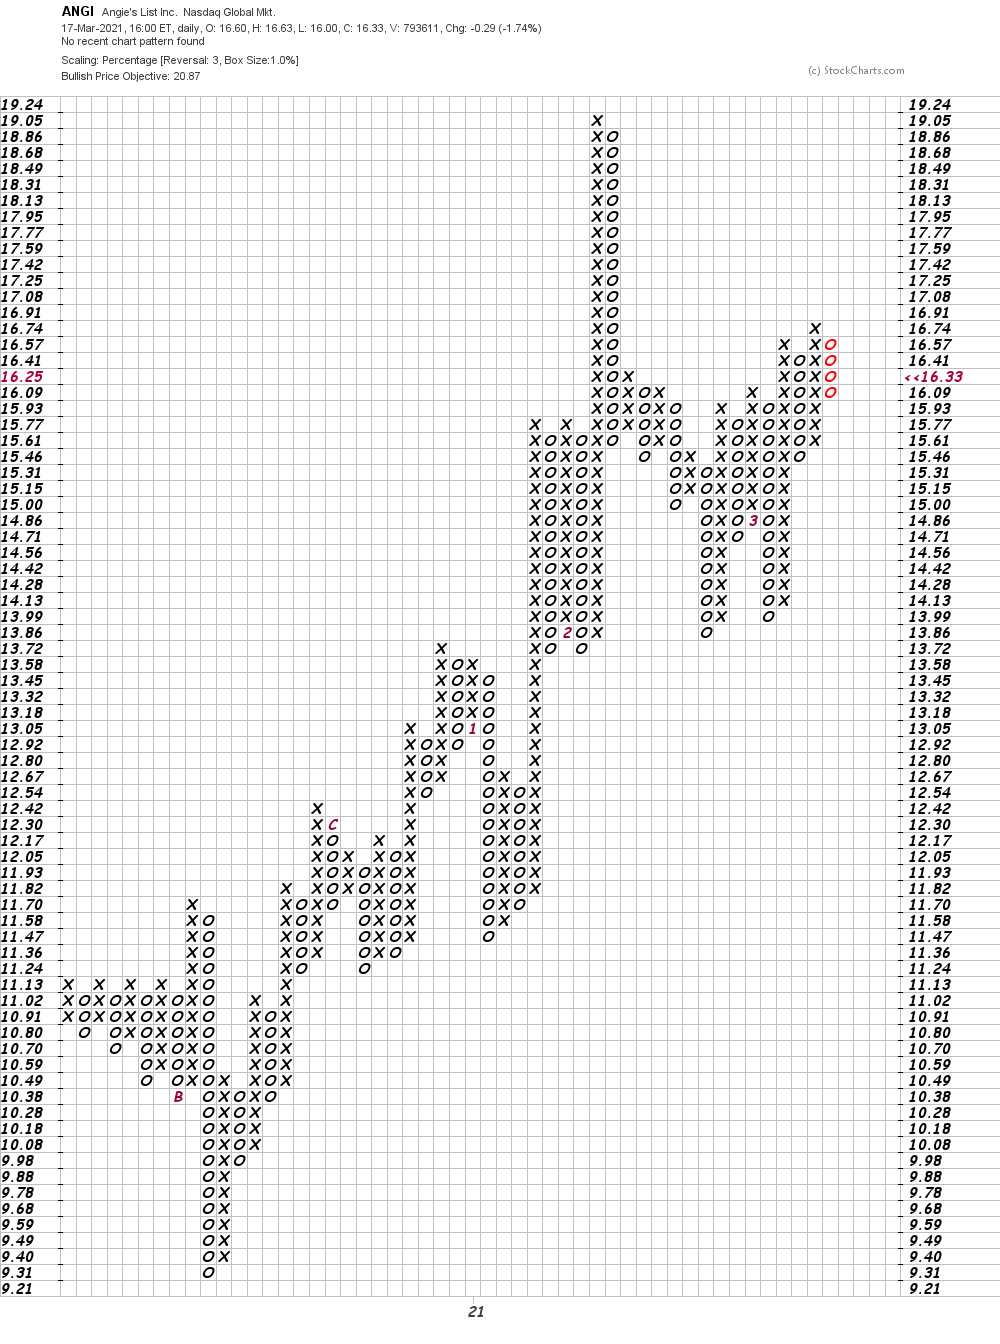
In this daily Point and Figure chart of ANGI, below, we can see a potential upside price target in the $21 area.
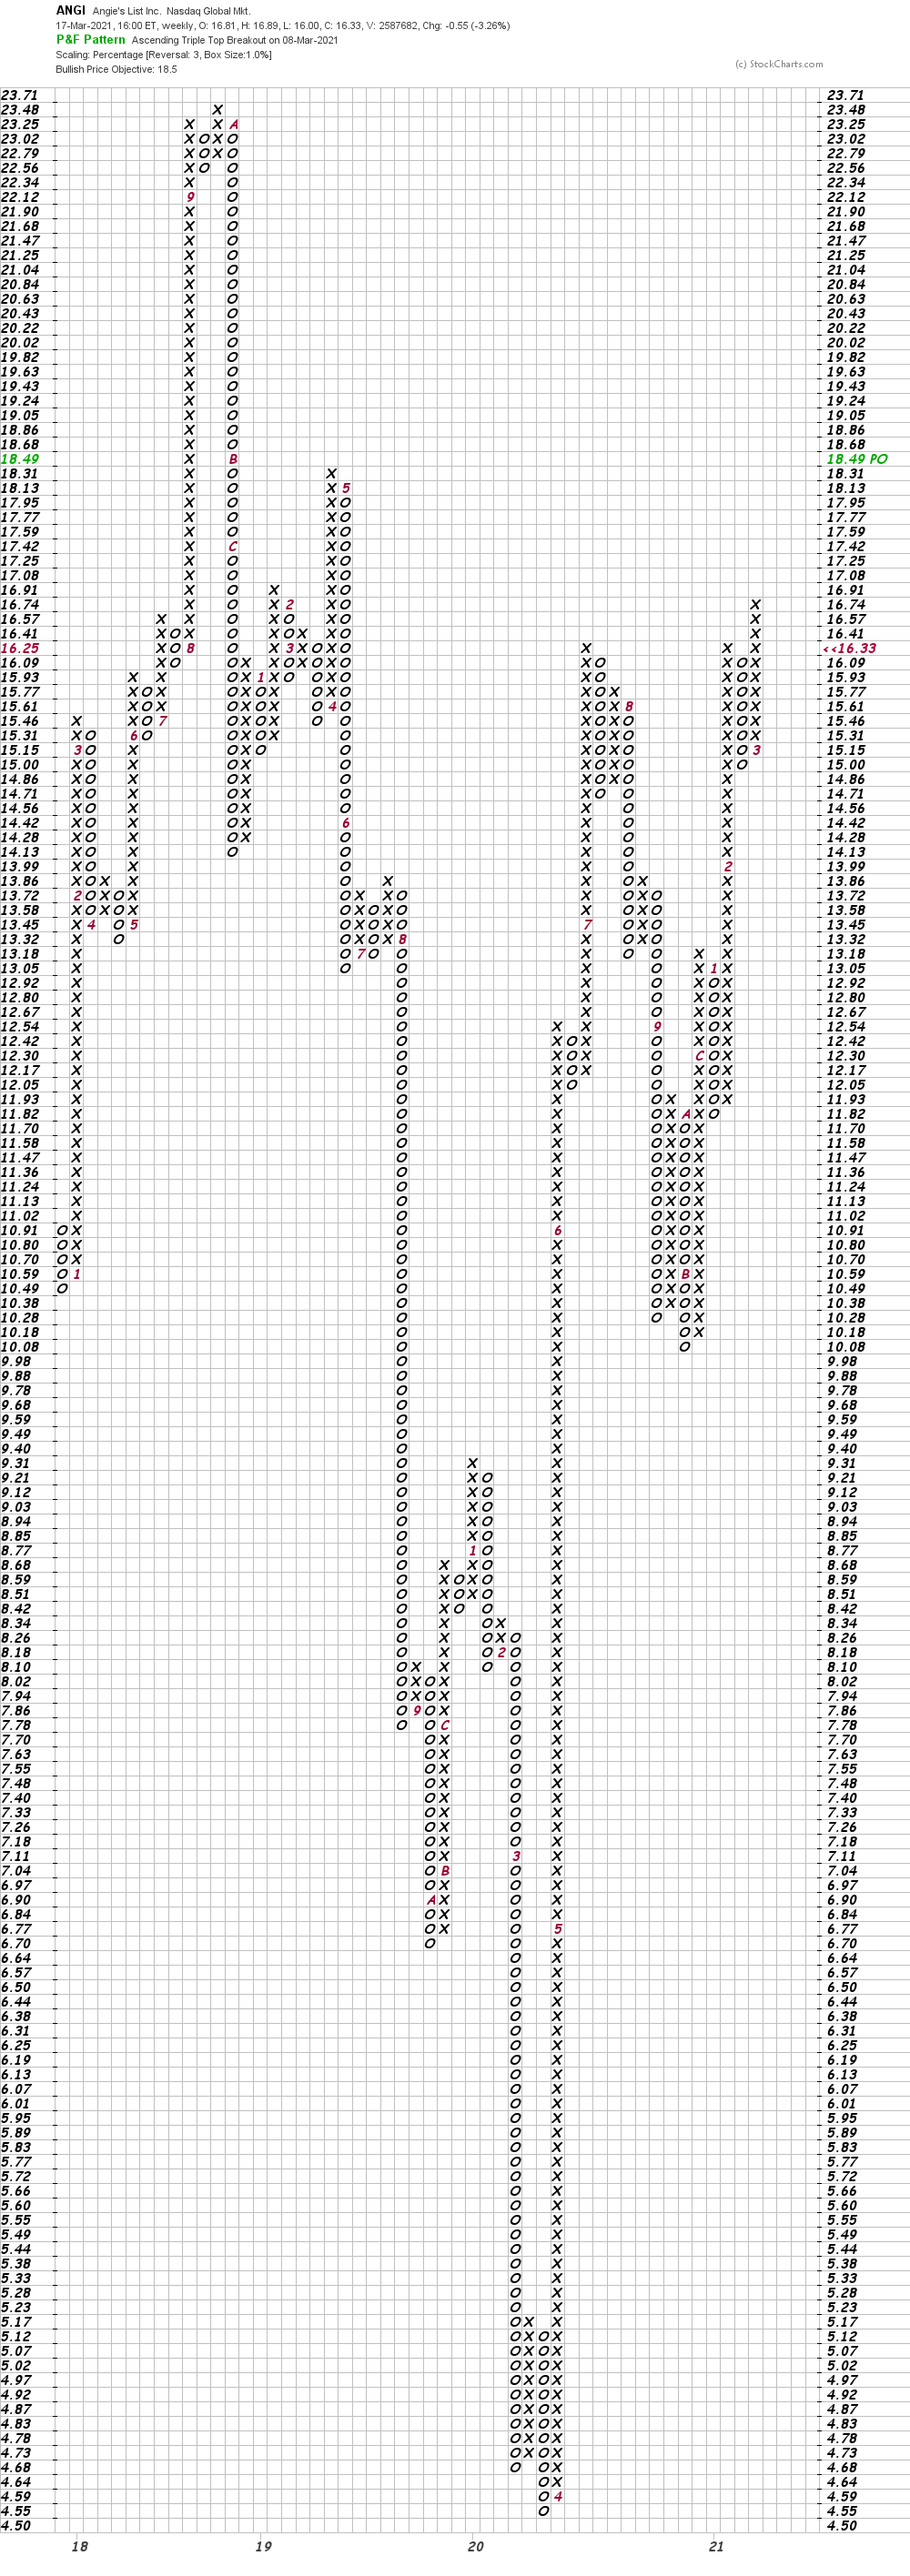
In this second Point and Figure chart of ANGI, below, we used weekly close-only price data and here the software shows only a $19 price target. Typically, weekly close-only charts yield more bullish price objectives. Pause for thought?
Bottom line strategy: In full disclosure I have used the company’s website a few times and found it flawed. It did not suggest contractors that actually did the work I needed. Only one of the contractors jumped to contact me. Maybe the others were too busy. My local HOA/Facebook page actually does a good job finding various trades people. Just saying.
The volume pattern and the OBV line make me a little skeptical of recommending the long side of ANGI at this point in time. I would stand aside for now.
Get an email alert each time I write an article for Real Money. Click the “+Follow” next to my byline to this article.


More Stories
Choose a Best Home Which Fits on Your Budget
Protect Your Home by Choosing the Best Roofing Contractors
Design Guide: Creating the Perfect Home Office